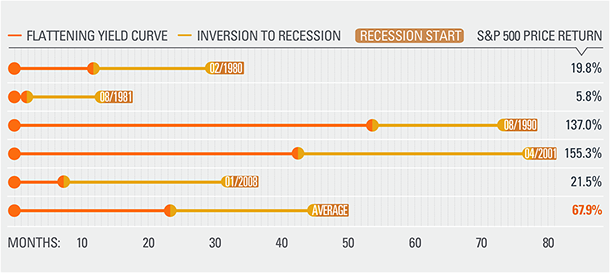
A Flatter Yield Curve Doesn’t Necessarily Mean a Recession Is Around the Corner
– A look at the last five economic cycles shows that once the yield curve flattens (represented by a spread reaching 0.5%) the time to recession averaged almost four years.
– Stock prices climbed by an average of 67.0% during that period.
Click here to download a PDF of this report.
Source:
LPL Research, FactSet 06/15/18
Important Disclosures:
Yield curve steepness in this chart reflects the difference between the 10-year and 2-year Treasury yield.
Flattening yield curve is represented by a 0.5–0% spread between short- and long-term rates.
The Standard & Poor’s 500 Index is a capitalization-weighted index of 500 stocks designed to measure performance of the broad domestic economy through changes in the aggregate market value of 500 stocks representing all major industries.
All indexes are unmanaged and cannot be invested into directly. Unmanaged index returns do not reflect fees, expenses, or sales charges. Index performance is not indicative of the performance of any investment. All performance referenced is historical and is no guarantee of future results.
The opinions voiced in this material are for general information only and are not intended to provide or be construed as providing specific investment advice or recommendations for any individual security.
Tracking #1-748877 (Exp. 07/18)