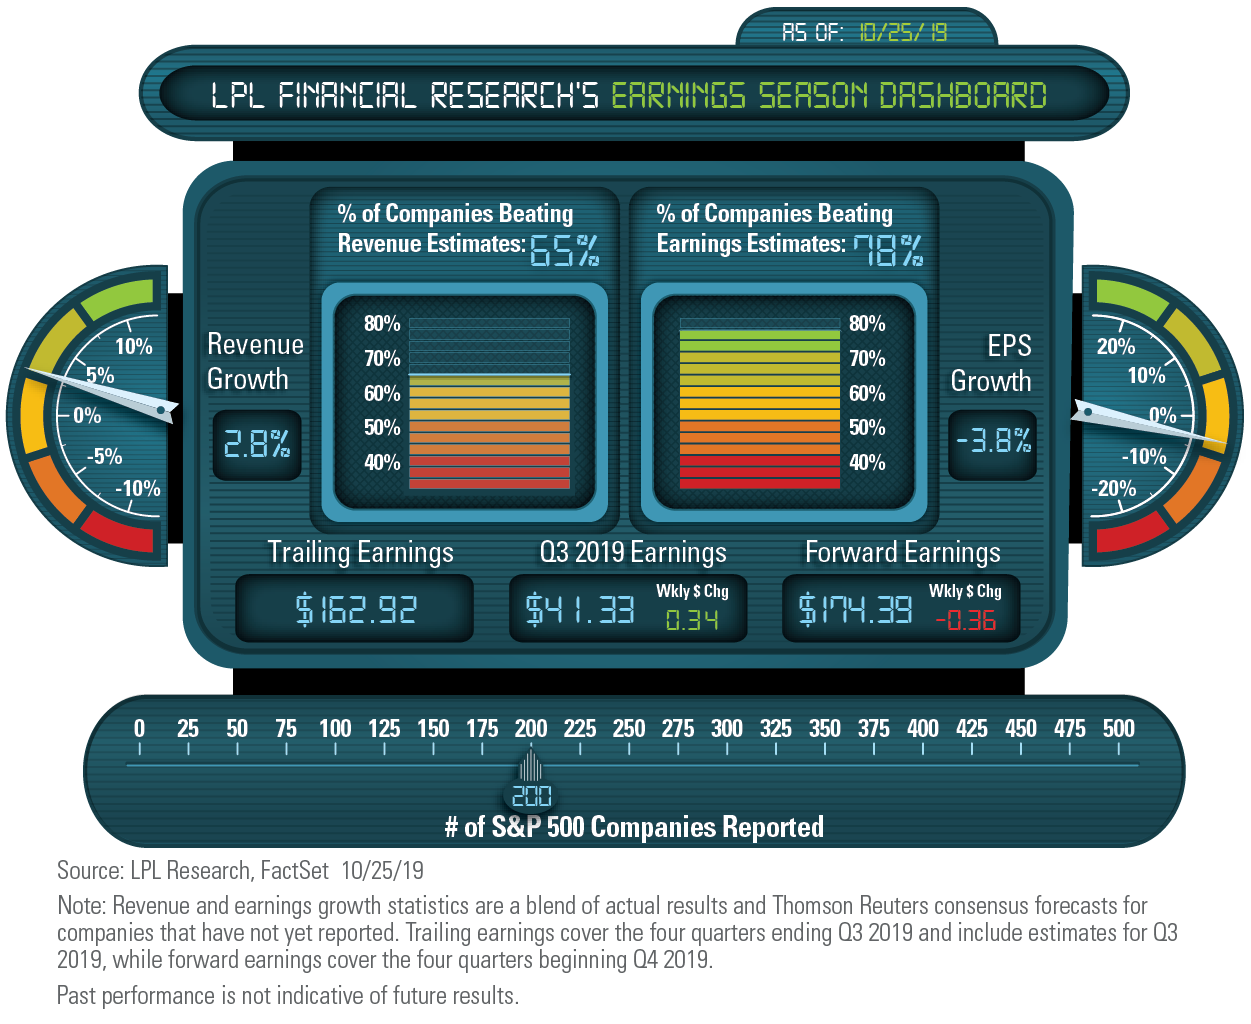
- With 200 S&P 500 companies having reported, third quarter 2019 earnings growth is tracking to a 3.8% year-over-year decline. Earnings upside of about 1% overall has been limited considering a strong 78% of companies having beaten forecasts.
- Estimates for the next 12 months have fallen 1% since September 30 — a typical quarterly reduction — amid trade uncertainty, weak U.S. manufacturing data, and slowing international growth.
Click here to download a PDF of this report.
Important Disclosures:
Note: Revenue and earnings growth statistics are a blend of actual results and Factset consensus forecasts for companies that have not yet reported. Trailing earnings cover the four quarters ending Q3 2019 and include estimates for Q3 2019, while forward earnings cover the four quarters beginning Q4 2019.
Past performance is not indicative of future results.
The economic forecasts set forth may not develop as predicted.
All indexes are unmanaged and cannot be invested into directly.
The S&P 500 Index is a capitalization-weighted index of 500 stocks designed to measure performance of the broad domestic economy through changes in the aggregate market value of 500 stocks representing all major industries.
Earnings per share (EPS) is the portion of a company’s profit allocated to each outstanding share of common stock. EPS serves as an indicator of a company’s profitability. Earnings per share is generally considered to be the single most important variable in determining a share’s price. It is also a major component used to calculate the price-to-earnings valuation ratio.
Because of their narrow focus, specialty sector investing, such as healthcare, financials, or energy, will be subject to greater volatility than investing more broadly across many sectors and companies
Tracking #1-909351