We believe pent-up demand, gradual improvement in supply chain challenges, solid labor force growth, and productivity gains will all contribute to another year of above-trend economic growth in 2022. COVID-19-related risks remain and the potential for a policy mistake may be elevated as the economy moves towards normalization, but we think the overall environment will be supportive of business growth and ultimately equity markets
The U.S. economy bounced back from its worst year since the Great Depression in 2020 with one of the best years of growth in nearly 40 years in 2021. A combination of record stimulus, a healthy consumer, an accommodative Federal Reserve (Fed), vaccinations, and reopening of businesses all contributed to the big year.
In what amounted to the shortest recession on record, only two months in March and April 2020, the economy came roaring back to produce what is currently expected to be over 5% GDP growth in 2021, more than making up for the 3.4% drop in GDP in 2020. Of course, there have been hiccups along the way. You can’t shut down a $20 trillion economy and then expect it to get going again without warming up first. Supply chain backlogs, materials and labor shortages, and higher prices all held the economy back to varying degrees. The good news is, demand is still very strong, and as the backlogs unwind (which could take years in some cases), we expect above-trend economic growth and see low risk of a recession in 2022.
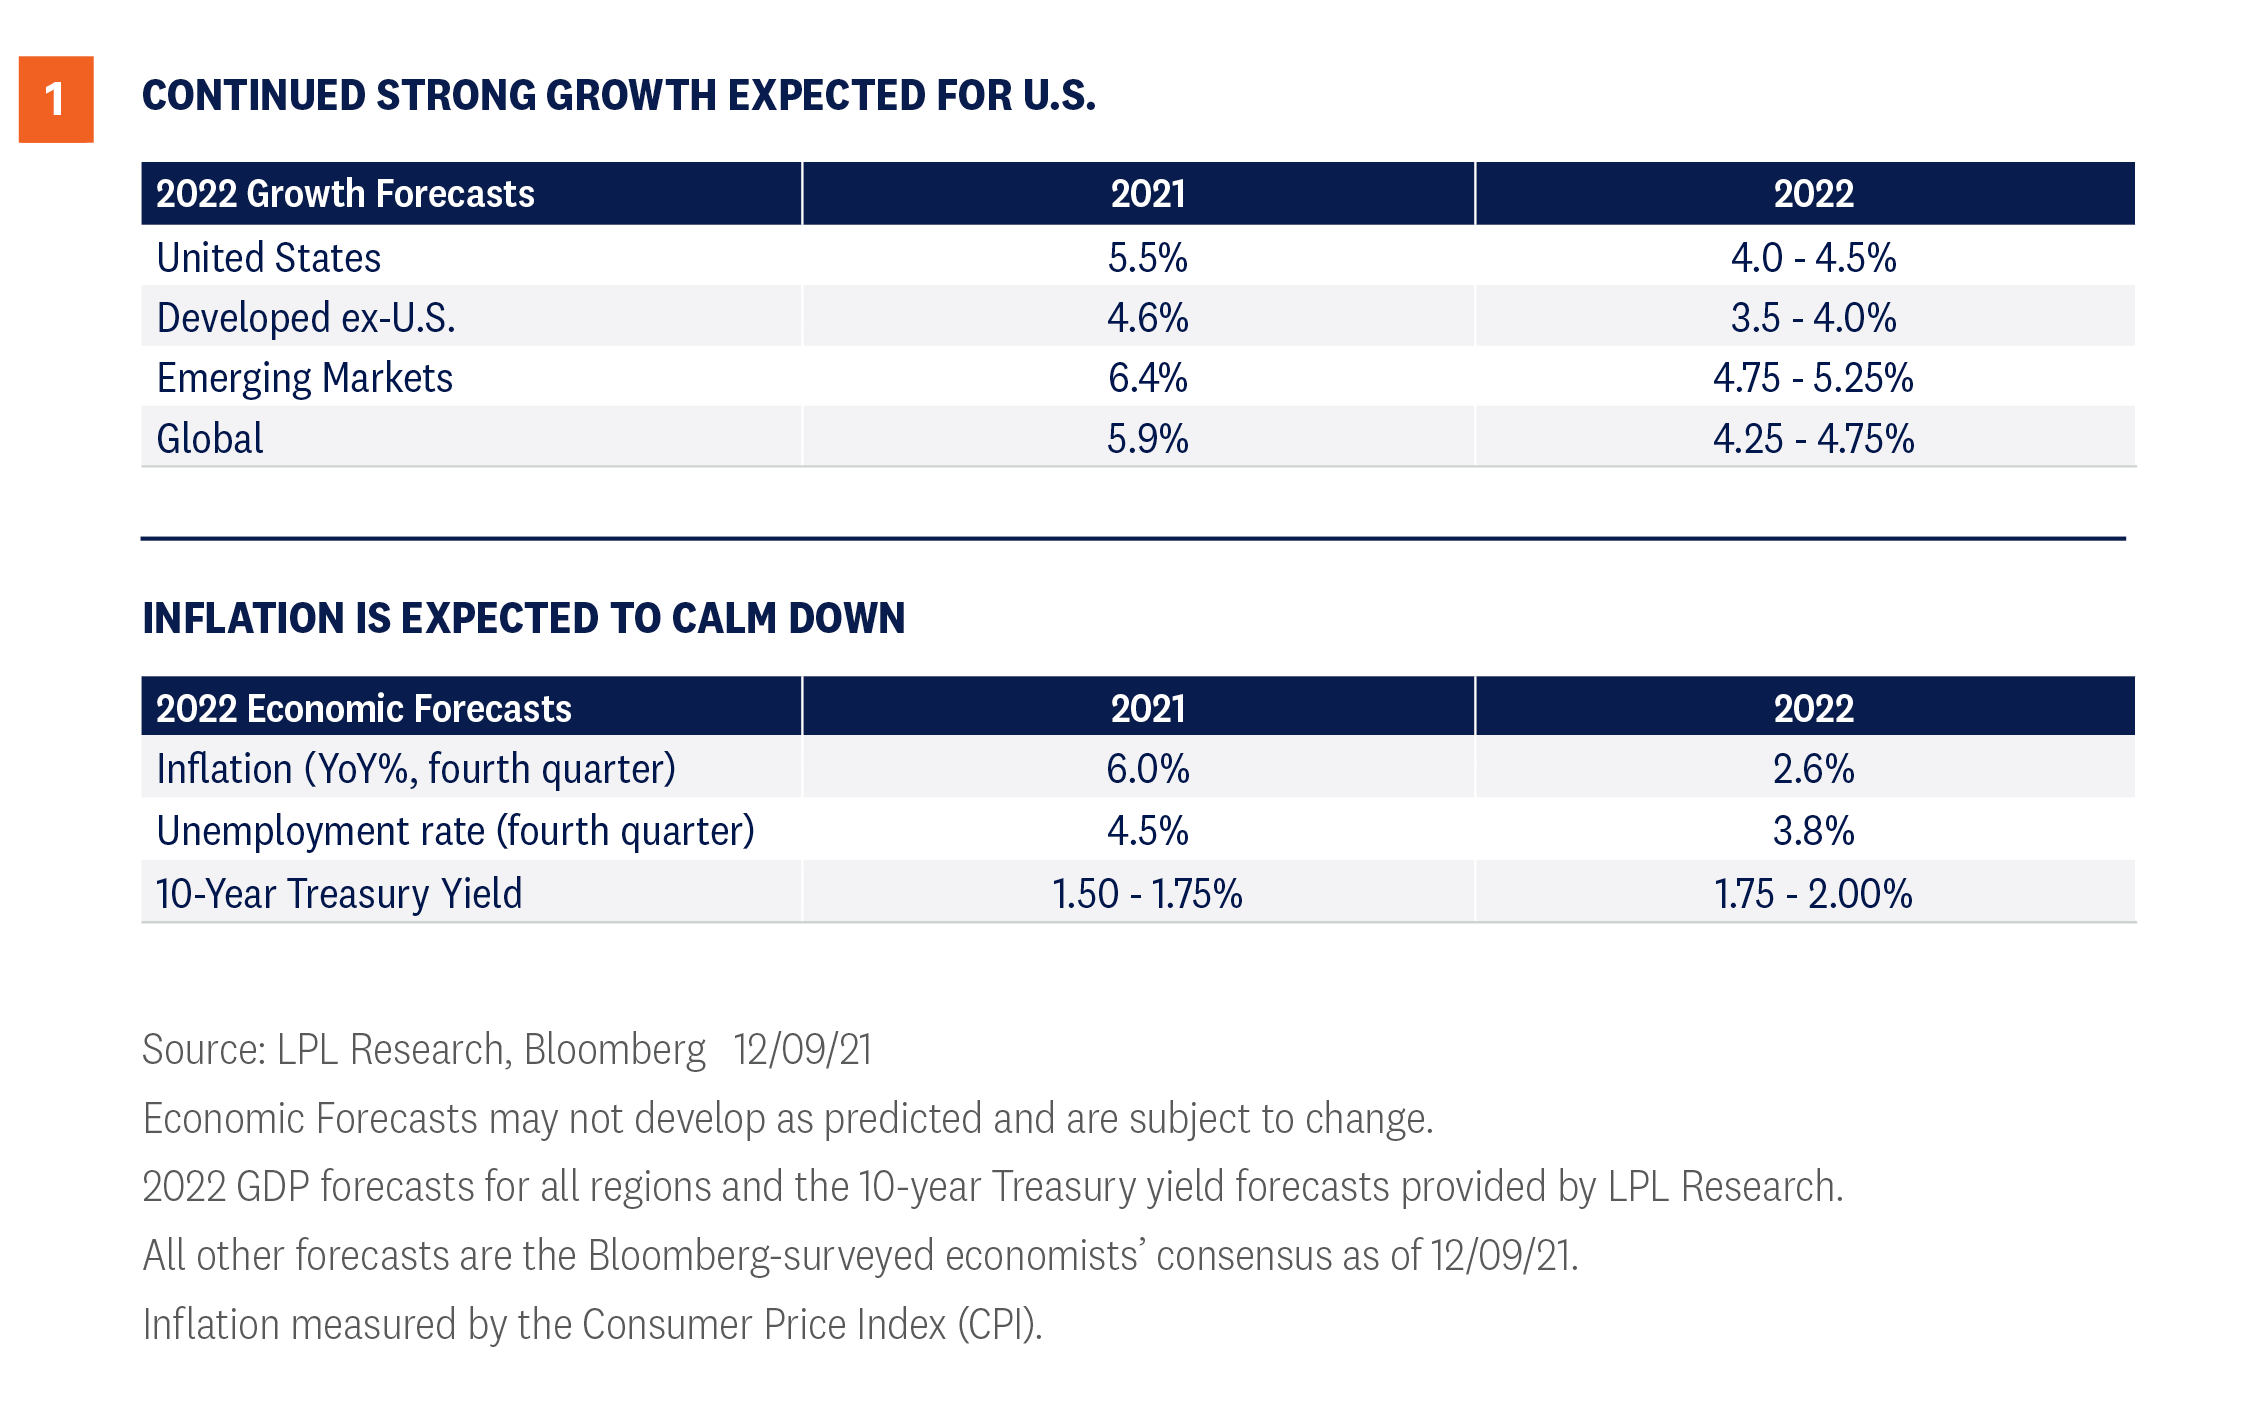
As the U.S. economy moves more to mid-cycle, our 2022 forecast is for 4.0–4.5% GDP growth in 2022 [Figure 1]. While a slowdown from 2021, it’s still a very solid number. We expect inflation to tame from 2021 levels to a potential run rate under 3% by the fourth quarter with core inflation numbers lower, a step in the right direction, although it may still be on an upward trajectory the early part of the year.
Globally, Europe and Japan were hit especially hard by the pandemic in 2021. But as COVID-19 cases potentially fall globally, those areas could be ripe for better economic growth in 2022. Meanwhile, emerging market economies may disappoint as growth in China could be constrained by regulatory crackdowns.
TIME FOR A HANDOFF
Fiscal and monetary policy played big roles in the economic recovery in 2021, but we see 2022 playing out as a handoff—from stimulus bridging a pandemic recovery to an economy growing firmly on its own, with consumer demand, workforce gains, productivity, small businesses expansion, and capital investment all playing parts in the next stage of economic growth.
You have to give the U.S. consumer credit for continuing to drive the economy forward, and 2022 shouldn’t change that. Don’t forget, it took retail sales only five months to get back to pre-COVID-19 levels after the lockdowns in March and April 2020. Bottlenecks and the Delta variant surge have done little to slow an eager consumer. With likely still low interest rates, increased equity in people’s homes, nearly $3 trillion in money markets (retail and institutional), and another $3.5 trillion in excess liquidity in bank accounts, the consumer should remain quite healthy in 2022.
Like every other time in history, those who adapt will survive. Businesses have already started to adapt to the new world, which may help productivity increase in 2022, as output-per-hour (productivity) potentially starts to accelerate again. Productivity allows for stronger growth and can help contain inflation, since more goods and services are produced. The 1970s was known as a time of high inflation, but it was also a time of very low productivity—fortunately a scenario we don’t see happening this time around.
Another key to the economic transition may be capital expenditures (capex). These include business investment in property, plants, buildings, technology, and equipment. These investments could boost overall productivity and overall output, but might take time to build, so the results could be years away in some cases. Additional capex spending would be one of the best ways to see if corporate America is indeed over the shock of the pandemic and ready to invest for future growth opportunities. Standard and Poor’s data shows capital expenditures are expected to have grown an impressive 13% in 2021 and likely even more in 2022. In fact, the capex rebound in this recovery has already been faster than previous downturns, with plenty of room to go in our view. And it isn’t just a U.S. theme, as 2021 was likely the best year for European capex since 2006, and the global chip shortage has led to major investments in Japan and South Korea as well.
THE EVERYTHING SHORTAGE
2021 was the year nearly everything was in a shortage, and it all translated to added inflationary pressure. Record numbers of ships waiting at ports, a lack of materials, unfilled job openings, higher commodity prices, a lack of truck drivers, major backlogs, and supply chain disruptions all added to the larger price increases seen essentially across the board in 2021.
While we do believe these pressures will steadily decrease over the next year and inflation will eventually settle back to 2–2.5%, it will likely be a gradual process. While inflation is broadly elevated, some key core elements remain more stable, and we believe these will be the center of gravity over time for some of the more volatile price changes we’ve seen. Still, supply chains may take a year or two to be fully addressed, depending on the product and the scale of the problem. Despite challenges around supply chains, hiring, and prices, if the demand is there it should help drive continued improvement as businesses adapt to address challenges. That is likely to leave us with a positive economic backdrop for at least 2022, and maybe much longer, despite current inflation levels.
HOW MUCH TIME LEFT?
Let’s face it, this wasn’t your average recession. Some industries actually did better during the pandemic, while segments of other industries were severely constrained. Spending patterns shifted. Stimulus was delivered quickly on a massive scale. How strange did that make it? This was the first recession in history that saw FICO scores go up. Recessions are necessary to wash out the excesses, but some imbalances weren’t worked off this time around. For this reason, we think this economic expansion could be mid-cycle much sooner and likely won’t be as long as the record 10 years we saw last cycle. The average expansion since World War II has been just over five years, suggesting there are still potentially several years of growth remaining, especially since we don’t see typical recessionary warning signals right now. Far from it, we anticipate above-trend growth in 2022. But we’ll be on watch early.
RISKS AND MARKET IMPLICATIONS
Our baseline economic outlook would likely provide a positive backdrop for equity markets, supporting further earnings gains while productivity gains potentially help offset some of the margin pressure from wage growth. At the same time, there are clear risks to our view. Handoffs can be fumbled and with inflation running hot and risks around COVID-19 still in play, the potential for a policy mistake is elevated. And while we’ve made substantial progress against COVID-19, ranging from vaccines to treatments to public health policy, we don’t yet have full clarity on how it will continue to impact the economy. Nevertheless, our baseline is a continued move toward normalcy as the choices of businesses and households play a bigger role in determining the shape of the expansion.
Click here to download a PDF of this report.
______________________________________________________________________________________________
IMPORTANT DISCLOSURES
This material is for general information only and is not intended to provide specific advice or recommendations for any individual. There is no assurance that the views or strategies discussed are suitable for all investors or will yield positive outcomes. Investing involves risks including possible loss of principal. Any economic forecasts set forth may not develop as predicted and are subject to change.
References to markets, asset classes, and sectors are generally regarding the corresponding market index. Indexes are unmanaged statistical composites and cannot be invested into directly. Index performance is not indicative of the performance of any investment and does not reflect fees, expenses, or sales charges. All performance referenced is historical and is no guarantee of future results.
Any company names noted herein are for educational purposes only and not an indication of trading intent or a solicitation of their products or services. LPL Financial doesn’t provide research on individual equities.
All information is believed to be from reliable sources; however, LPL Financial makes no representation as to its completeness or accuracy.
U.S. Treasuries may be considered “safe haven” investments but do carry some degree of risk including interest rate, credit, and market risk. Bonds are subject to market and interest rate risk if sold prior to maturity. Bond values will decline as interest rates rise and bonds are subject to availability and change in price.
The Standard & Poor’s 500 Index (S&P500) is a capitalization-weighted index of 500 stocks designed to measure performance of the broad domestic economy through changes in the aggregate market value of 500 stocks representing all major industries.
The PE ratio (price-to-earnings ratio) is a measure of the price paid for a share relative to the annual net income or profit earned by the firm per share. It is a financial ratio used for valuation: a higher PE ratio means that investors are paying more for each unit of net income, so the stock is more expensive compared to one with lower PE ratio.
Earnings per share (EPS) is the portion of a company’s profit allocated to each outstanding share of common stock. EPS serves as an indicator of a company’s profitability. Earnings per share is generally considered to be the single most important variable in determining a share’s price. It is also a major component used to calculate the price-to-earnings valuation ratio.
All index data from FactSet.
This research material has been prepared by LPL Financial LLC.
Securities and advisory services offered through LPL Financial (LPL), a registered investment advisor and broker-dealer (member FINRA/SIPC). Insurance products are offered through LPL or its licensed affiliates. To the extent you are receiving investment advice from a separately registered independent investment advisor that is not an LPL affiliate, please note LPL makes no representation with respect to such entity.
Not Insured by FDIC/NCUA or Any Other Government Agency | Not Bank/Credit Union Guaranteed | Not Bank/Credit Union Deposits or Obligations | May Lose Value
RES-977801-1221| For Public Use | Tracking # 1-05221199 (Exp. 12/22)