Third quarter earnings season winds down over the next couple of weeks and has once again met Wall Street’s high expectations. After tariff-muddled first quarter results, companies did a good job adjusting to tariffs in the second quarter and continued to do so last quarter. A strong beat rate and another quarter of double-digit earnings growth proved corporate America’s resilience, bolstered by mega cap technology’s artificial intelligence (AI) investment. Here we recap third quarter earnings season, when more stayed the same than changed. Hat tip to profit margins.
One of the Highest Beat Rates Ever Recorded
Corporate America delivered another exceptional earnings season, with companies continuing to adjust to a shifting macroeconomic landscape. Companies effectively navigated cost pressures during the quarter (of note, tariffs were less of a focal point in earnings calls), although a few moving pieces supported third quarter results.
Among earnings highlights:
-
S&P 500 earnings per share (EPS) growth is tracking over 13%, with 95% of companies having reported, cruising past the 7.4% consensus forecast at quarter-end on September 30.
- S&P 500 revenue grew 8.4%, an atypically strong 2.5% above expectations at quarter-end.
-
The average earnings upside surprise of 7.0% matches the 10-year average but fell short of the 8.4% five-year average. Given the bar has been steadily rising over the past six months, these numbers are more impressive than they seem on the surface.
-
A strong 82% of companies beat EPS targets, above the five-year average (78%) and nearly topping the third quarter of 2021’s recent high of 82.2%. Prior to the post-COVID-19 earnings rebound when analysts got caught way offsides, we find no higher beat rate since the start of this data set in 2009.
- The revenue beat rate of 76% tops the five-year average (70%).
-
The fastest earnings growth for the quarter was generated by technology (28.4%), financials (23.5%), and utilities (23.1%).
- Technology (15.9%), healthcare (10.4%), and communication services (10.0%) delivered the strongest revenue growth.
Several factors likely played a role in last quarter’s strong results. Unexpectedly strong economic growth in the third quarter provided support. Gross domestic product (GDP) growth may reach 3% annualized despite the slowdown in job growth. Lower expected tariffs helped, as the amount of upside was likely inflated by companies guiding conservatively for the third quarter back in July and August given the uncertainty.
Bottom line, these numbers are quite impressive, particularly given the current economic and earnings cycles have been going awhile post-COVID-19. Expectations keep rising, the bar keeps going higher, and corporate America continues to clear it handily.
String of Double-Digit Earnings Growth Extended; Will it Continue?
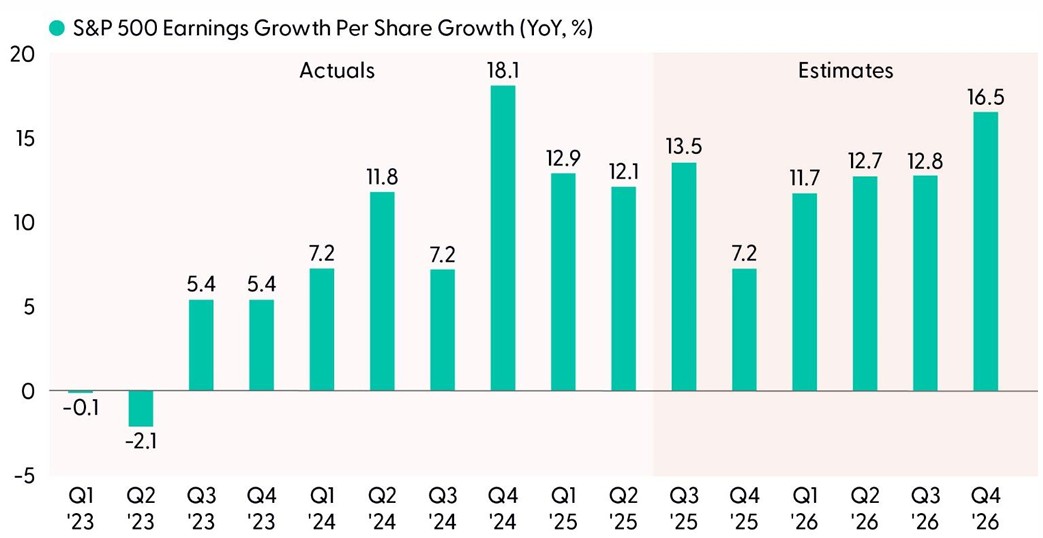
Source: LPL Research, Bloomberg 11/20/25
Disclosures: Past performance is no guarantee of future results. Indexes are unmanaged statistical composites and cannot be invested in directly.
Any companies or options referenced are being presented as a proxy, not as a recommendation.
*Based on consensus estimates. Estimates may not materialize as predicted and are subject to change.
Magnificent Seven Continues to Deliver Strong Growth
Big tech and the Magnificent (Mag) Seven remained on center stage this earnings season, delivering another quarter of robust earnings growth. As shown in the “Mag Seven Earnings Growth Poised to Slow But Remains Robust” chart, this group continues to dominate the earnings growth of the rest of the S&P 500. The Mag Seven drove about half of the 15–16% earnings growth for the S&P 500 in the third quarter if Meta’s (META) $15.9 billion one-time tax change is excluded. Excluding Tesla (TSLA), the Mag Seven grew earnings about 30% as a group. The third quarter saw a slight acceleration in Mag Seven earnings growth, suggesting to us that estimates over the next couple of quarters could be too low. The earnings growth gap between mega cap tech and the rest of the market is still huge right now, even if poised to narrow in 2026, and underpins LPL Research’s continued preference for large growth equities over their large value counterparts.
This group of mega cap stocks has notably increased capital expenditures (capex) spending plans. The big five hyperscalers raised capex guidance for 2025 and 2026, with the latest guidance indicating spending could surpass $560 billion by 2027. These huge investments support earnings because — assuming they happen — they are revenue for someone, and they help drive productivity gains that can boost profit margins for all of corporate America. That said, given these hyperscalers are spending around 25% of revenue on capex, and their capex is draining free cash flows, Wall Street may demand more proof of return on investment going forward. AI adoption is still early innings.
Mag Seven Earnings Growth Poised to Slow But Remains Robust
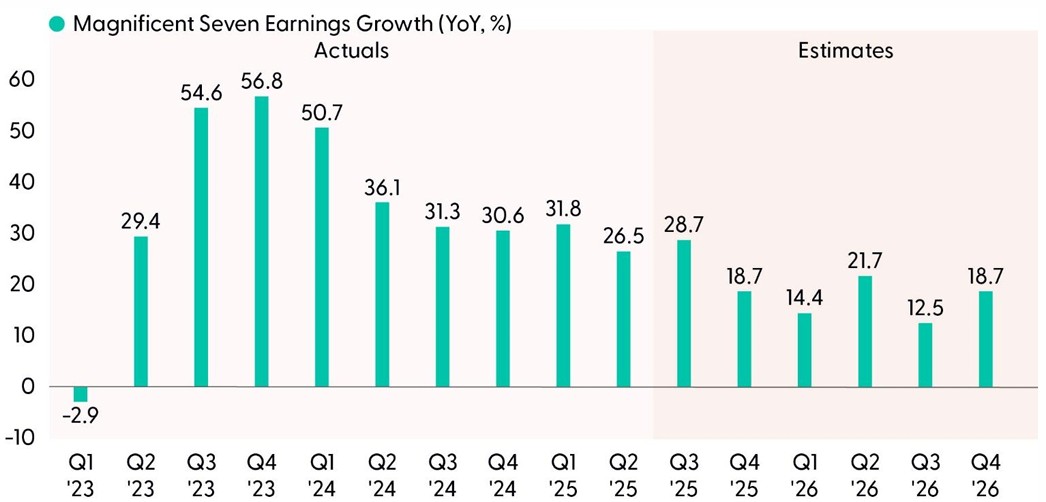
Source: LPL Research, Bloomberg 11/20/25
Disclosures: Past performance is no guarantee of future results. Indexes are unmanaged statistical composites and cannot be invested in directly.
Estimates may not materialize as predicted and are subject to change. Magnificent (Mag) Seven includes Alphabet (GOOG/L), Amazon (AMZN), Apple (AAPL), Meta (META), Microsoft (MSFT), NVIDIA (NVDA), and Tesla (TSLA).
Margins More Than Held Up In The Face of Tariffs
The largest portion of the higher tariffs was expected to come through during the third quarter as pre-tariff inventory dwindled and Washington’s tariff pause concluded. But in arguably the biggest surprise of the season, net profit margins for the S&P 500 increased to an all-time high, an impressive accomplishment given more tariffs were paid in the third quarter than in the second.
Technology, financials, and communication services led year-over-year net margin increases. Services businesses (such as telecommunications and banks) remained relatively insulated from cost pressures last quarter, while other actions to preserve margins, such as passing costs on to consumers, cost cuts, or AI-driven productivity enhancements, helped absorb some of the impact.
Operating margins, a useful metric in measuring the efficiency of core business operations, expanded to 16%, marking the highest reading for the metric since the second quarter of 2022 and increasing for the third consecutive quarter (the biggest items removed from net margin to get to operating margin are interest costs and taxes).
Considering the bulk of tariff effects have likely trickled through and margins still expanded, efficiency and profitability remain on solid footing across the market. In the years ahead, AI is poised to drive operating margin growth. As shown in the “With Most Tariffs Absorbed, Time for AI to Drive Margins Higher,” S&P 500 operating margin forecasts are expected to exceed 17.5% within a year’s time, largely on the back of big tech names.
With Most Tariffs Absorbed, Time for AI to Drive Margins Higher
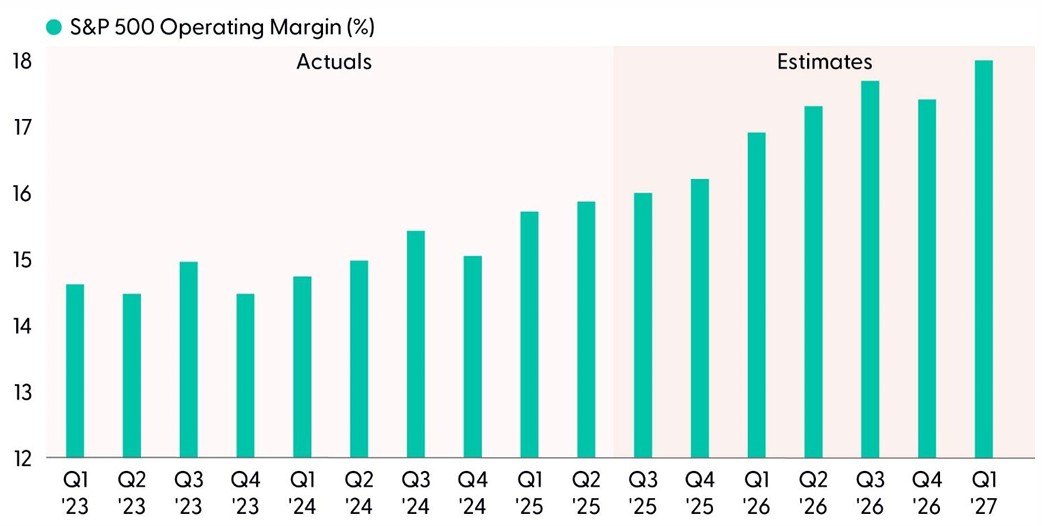
Source: LPL Research, Bloomberg 11/20/25
Disclosures: Past performance is no guarantee of future results. All indexes are unmanaged and can’t be invested in directly.
Estimates may not materialize as predicted and are subject to change.
As 2026 Approaches, Capital Investment Dollars Keep Getting Bigger
We sound like a broken record but it’s impressive and unusual — or at least it used to be — for earnings estimates to rise during earnings season. The consensus estimate for S&P 500 EPS rose during both second quarter and third quarter earnings seasons. Not only that, but the $305 per share consensus S&P 500 earnings per share (EPS) estimate is in line with where it was back on April 1, before President Trump’s so-called “Liberation Day” tariff announcement.
Corporate America offsetting the entire tariff hit is impressive enough; but remember consensus S&P 500 earnings estimates fall about 6% on average during the calendar year. This year, despite tariff costs coming through, the consensus S&P 500 EPS estimate for 2026 has fallen just 1%. Given the massive ongoing ramp in AI investment from the five large hyperscalers building out most AI infrastructure, recovering that 1% is still possible; it would require 15% earnings growth next year.
Consensus Earnings Estimates Impressively Rose During Earnings Season
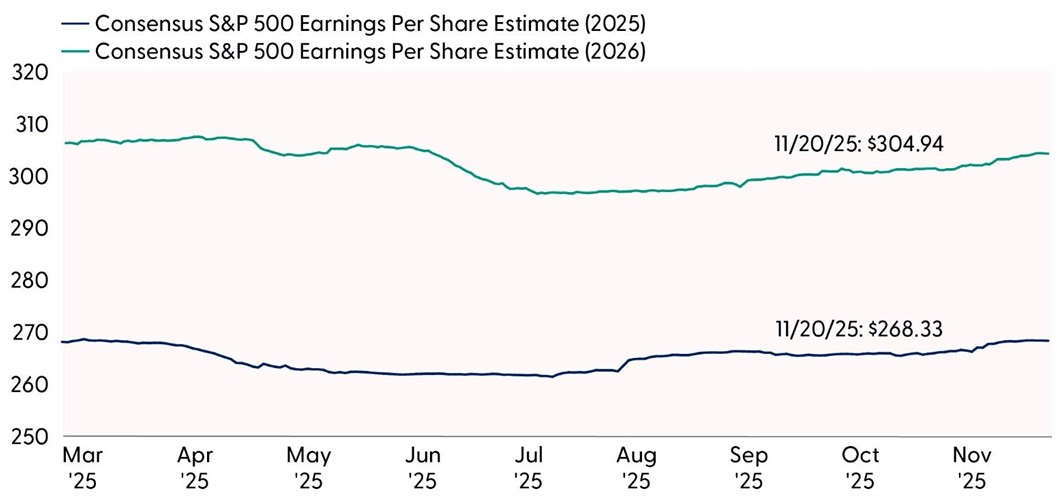
Source: LPL Research, Bloomberg 11/20/25
Disclosures: Past performance is no guarantee of future results. All indexes are unmanaged and can’t be invested in directly.
Estimates may not materialize as predicted and are subject to change.
Capital investment from the five primary hyperscalers — Alphabet (GOOG/L), Amazon (AMZN), Meta (META), Microsoft (MSFT), and Oracle (ORCL) is expected to increase 62% in 2025 and another 32% in 2026 based on recent consensus estimates, putting mid-teens earnings growth next year within reach if everything goes right. AI spend (if it comes through as expected, which is not guaranteed), some related productivity gains, and nearly 1% of gross domestic product in fresh stimulus will help.
Look for our official earnings forecast for 2026 in a couple of weeks when LPL Research’s Outlook 2026 is released.
Price Reaction, Consumer Takeaways Also In Focus
In other developments this earnings season, investors have notably rewarded EPS beats less than average. One-day price action following quarterly reports leans negative this season, with shares across five out of 11 sectors dropping after delivering results. The average S&P 500 stock fell 0.2% post-results, according to data from Evercore ISI Research. Companies beating on both the top and bottom line (“Double Beats”) are higher by 0.3% on average vs. the 0.8% five-year average, and “Double Misses” are lower by 1.5% vs. -3.2% on average. While corporate America has delivered a barnburner of an earnings season, shares have been getting more of the stick than the carrot. This is likely a product of the elevated amount of optimism priced into stocks, as well as AI scrutiny and the fluctuating odds of a Federal Reserve (Fed) rate cut in December.
Consumer takeaways from retailer earnings were interesting this week. Target (TGT) trimmed its profit outlook after missing revenue estimates, citing soft demand in key areas and value-oriented shoppers (also likely due to increased markdowns). This corroborated TJX Cos.’s (TJX) report, which benefited from shoppers turning to cheaper options, such as the parent company’s discount chains TJ Maxx and Marshalls. Same story with discounter Ross Stores (ROST). Meanwhile, Home Depot’s (HD) report indicated that shoppers pulled back on remodeling and big ticket purchases last quarter, Lowe’s (LOW) results reflected softness in housing, and Walmart (WMT) flagged “some slight moderation” within lower-income households. Sticky inflation continues to weigh on consumers’ budgets by reducing real (after inflation) spending power, particularly for middle- and low-income consumers.
Conclusion
Third quarter earnings season continued to highlight corporate America’s resilience during periods of uncertainty. More tariff effects were felt last quarter and companies managed to not only meet the bar but also raise guidance, helping lift earnings estimates for both 2025 and 2026. The Mag Seven continues to be the dominant force behind earnings growth and AI investment is setting the stage for broader productivity gains across sectors. With the bulk of tariff-fueled margin pressures moving to the rearview mirror, the effects on U.S. companies have been less than initially feared, and many companies have proven adept at offsetting these costs through operational efficiencies.
Going forward, the combination of AI-driven productivity, supportive fiscal policy, and easing trade uncertainty is expected to propel continued strong earnings growth, especially if mega-cap tech continues its spending splurge. With a lot of optimism priced into stock prices, corporate America did its part. Strong earnings momentum continues to support equities.
Asset Allocation Insights
LPL’s Strategic and Tactical Asset Allocation Committee (STAAC) maintains its tactical neutral stance on equities. Investors may be well served by bracing for occasional bouts of volatility given how much optimism is reflected in stock valuations, but fundamentals remain broadly supportive. Technically, the S&P 500’s recent breakdown below its price channel introduces near-term downside risk. Shifts toward defensive leadership, waning market breadth, the lack of oversold conditions or a capitulation signal in implied volatility further add to the developing downside bias for stocks. However, importantly, the broader market’s long-term uptrend remains intact, setting up a potential dip buying opportunity between now and year-end.
STAAC’s regional preferences across the U.S., developed international, and emerging markets (EM) are aligned with benchmarks. The Committee still favors growth over value, large caps over small caps, and the communication services sector.
Within fixed income, the STAAC holds a neutral weight in core bonds, with a slight preference for mortgage-backed securities (MBS) over investment-grade corporates. The Committee believes the risk-reward for core bond sectors (U.S. Treasury, agency MBS, investment-grade corporates) is more attractive than plus sectors. The Committee does not believe adding duration (interest rate sensitivity) at current levels is attractive and remains neutral relative to benchmarks.
Important Disclosures
This material is for general information only and is not intended to provide specific advice or recommendations for any individual. There is no assurance that the views or strategies discussed are suitable for all investors or will yield positive outcomes. Investing involves risks including possible loss of principal. Any economic forecasts set forth may not develop as predicted and are subject to change.
References to markets, asset classes, and sectors are generally regarding the corresponding market index. Indexes are unmanaged statistical composites and cannot be invested into directly. Index performance is not indicative of the performance of any investment and do not reflect fees, expenses, or sales charges. All performance referenced is historical and is no guarantee of future results.
Any company names noted herein are for educational purposes only and not an indication of trading intent or a solicitation of their products or services. LPL Financial doesn’t provide research on individual equities.
All information is believed to be from reliable sources; however, LPL Financial makes no representation as to its completeness or accuracy.
All investing involves risk, including possible loss of principal.
US Treasuries may be considered “safe haven” investments but do carry some degree of risk including interest rate, credit, and market risk. Bonds are subject to market and interest rate risk if sold prior to maturity. Bond values will decline as interest rates rise and bonds are subject to availability and change in price.
The Standard & Poor’s 500 Index (S&P500) is a capitalization-weighted index of 500 stocks designed to measure performance of the broad domestic economy through changes in the aggregate market value of 500 stocks representing all major industries.
The PE ratio (price-to-earnings ratio) is a measure of the price paid for a share relative to the annual net income or profit earned by the firm per share. It is a financial ratio used for valuation: a higher PE ratio means that investors are paying more for each unit of net income, so the stock is more expensive compared to one with lower PE ratio.
Earnings per share (EPS) is the portion of a company’s profit allocated to each outstanding share of common stock. EPS serves as an indicator of a company’s profitability. Earnings per share is generally considered to be the single most important variable in determining a share’s price. It is also a major component used to calculate the price-to-earnings valuation ratio.
All index data from FactSet or Bloomberg.
This research material has been prepared by LPL Financial LLC.
Not Insured by FDIC/NCUA or Any Other Government Agency | Not Bank/Credit Union Guaranteed | Not Bank/Credit Union Deposits or Obligations | May Lose Value
For public use.
Member FINRA/SIPC.
RES-0006316-1025 Tracking #829054 | #829749 (Exp. 11/26)